
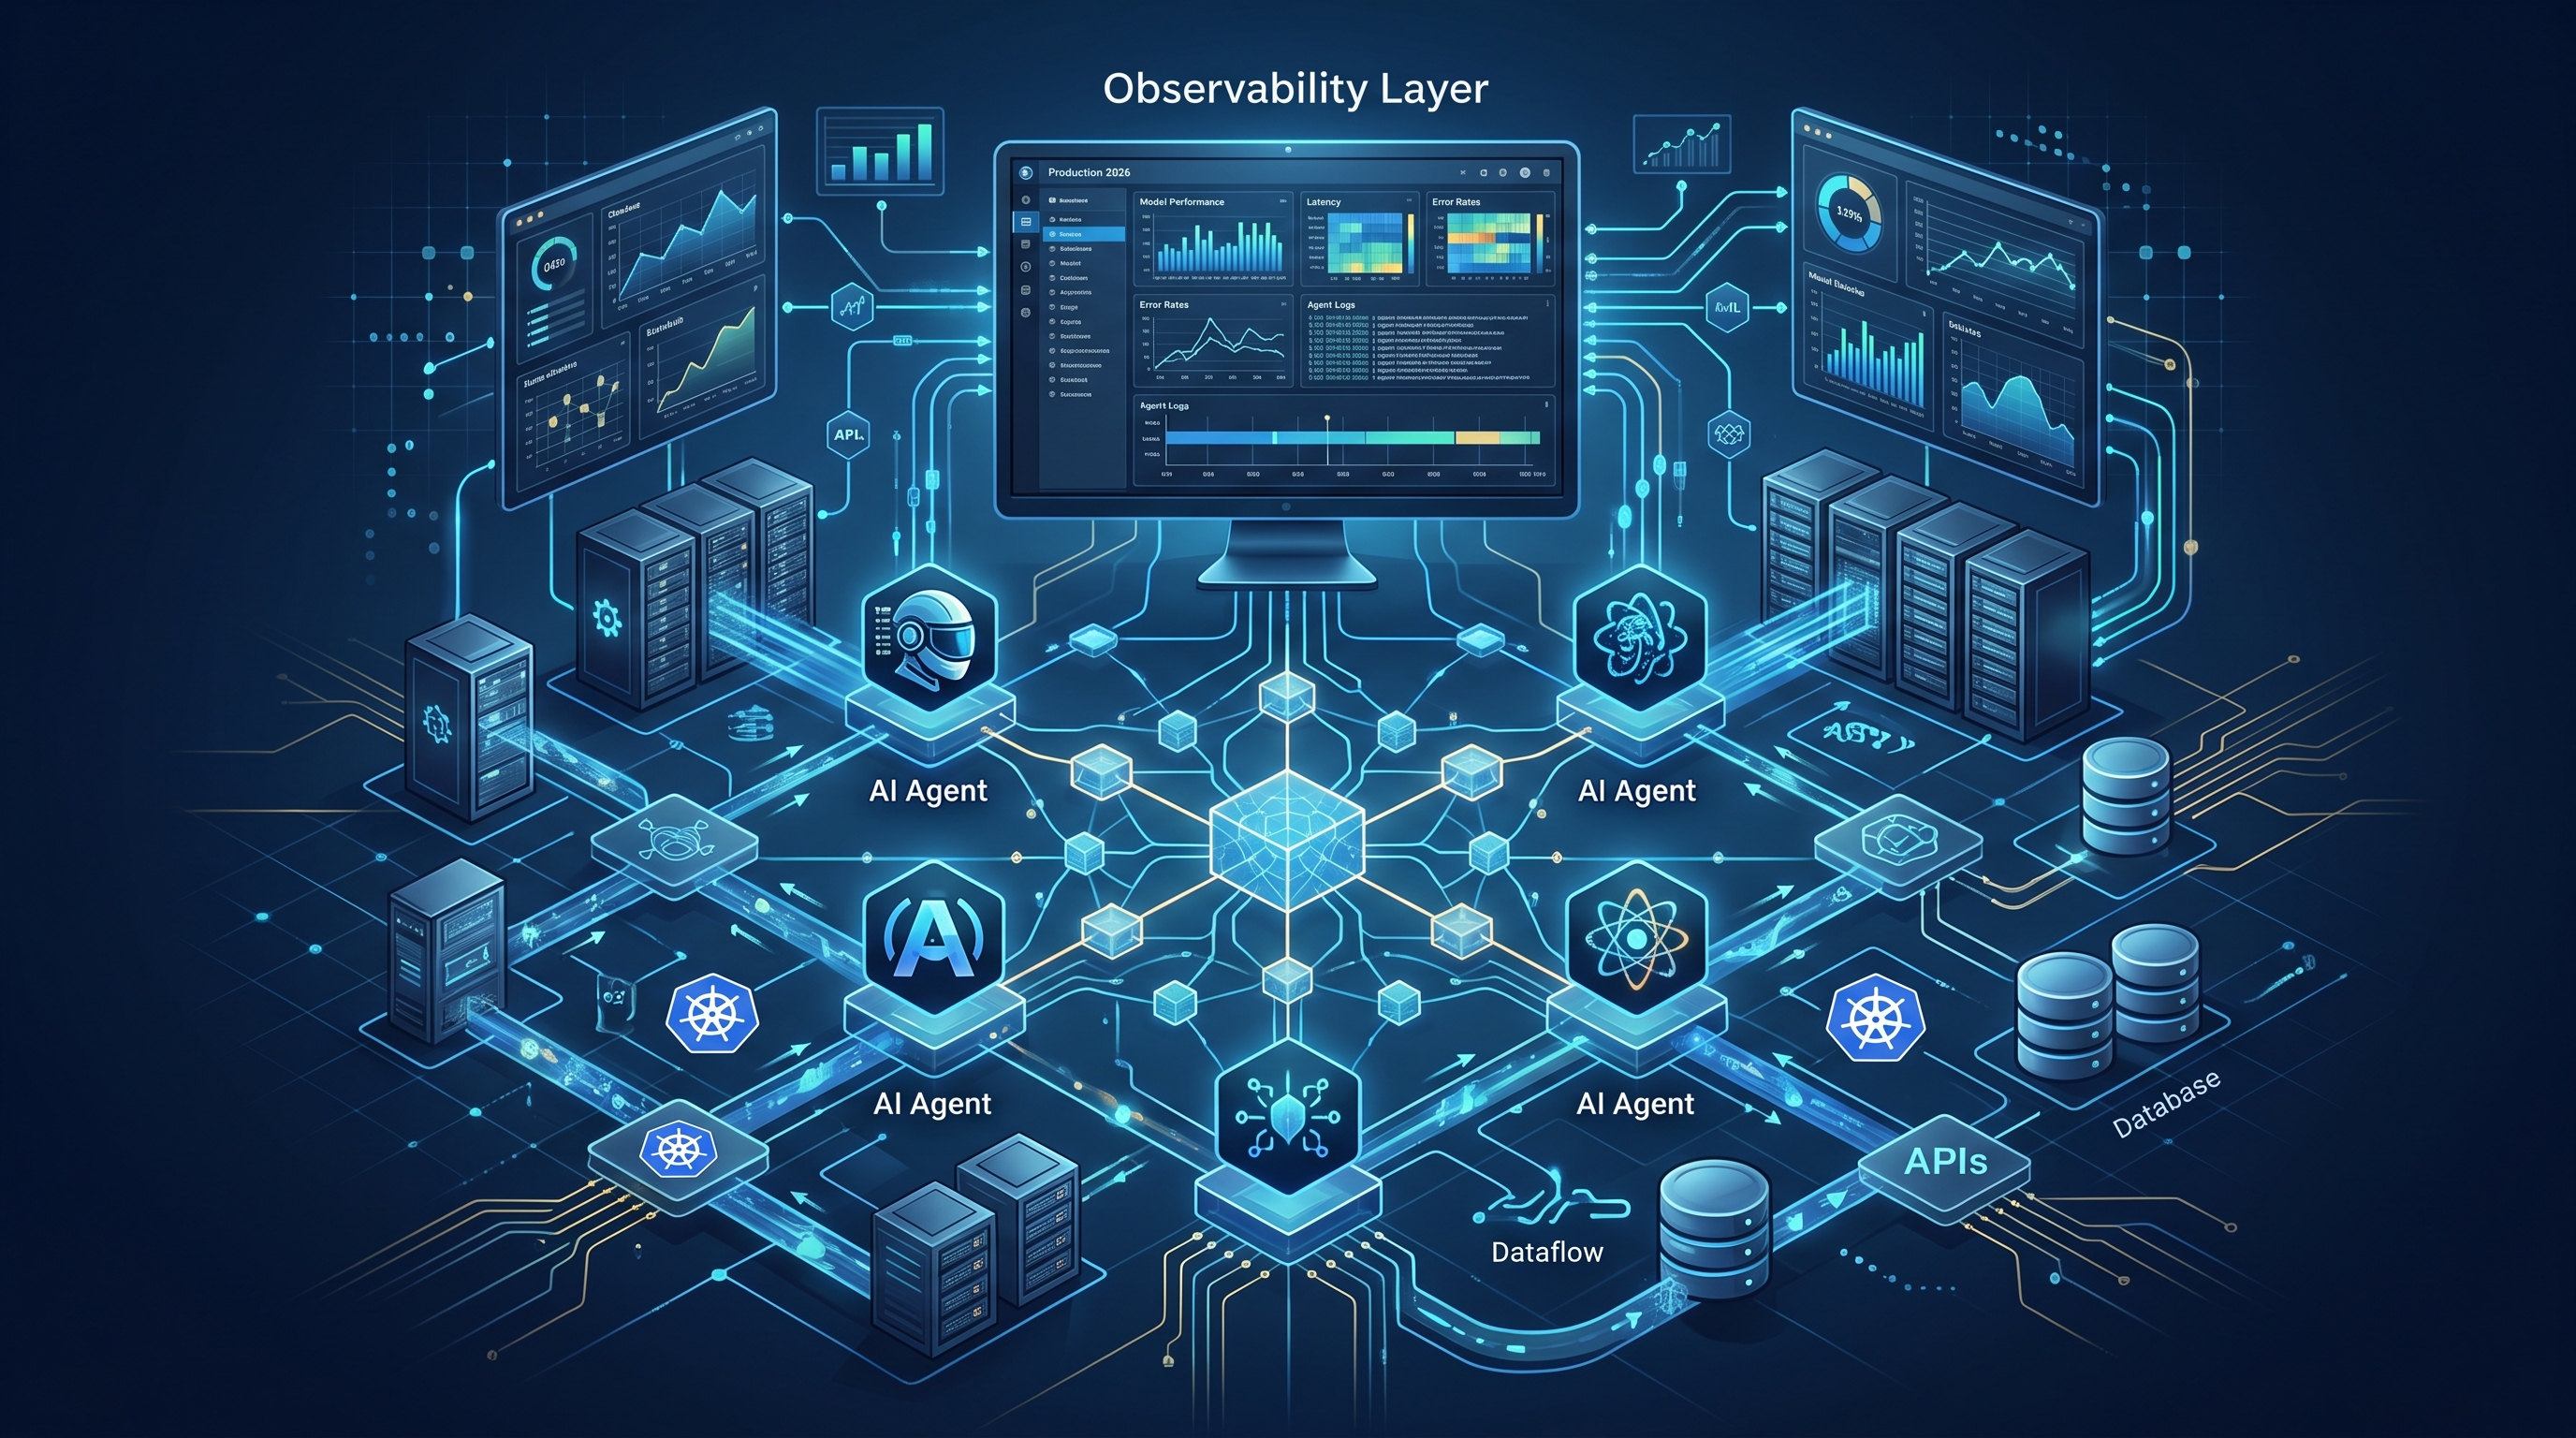
The End of Simple Prompt Logging
In 2023, we treated LLM integration like a function call: input prompt, output response, log the difference. It was simple, but it was wrong. By 2026, the landscape has shifted. We are no longer building chatbots; we are deploying autonomous agents that plan, execute tools, and maintain state across complex, multi-step workflows. The old logging paradigm is dead. If you are still just logging the raw LLM API calls, you are flying blind.
I've spent the last two years untangling the spaghetti code of agentic workflows, drawing on 25 years architecting systems at JPMorgan Chase and Deutsche Bank. The biggest bottleneck wasn't the model itself; it was the inability to debug why an agent took path A instead of path B. Observability in this context is not about monitoring uptime. It is about tracing the cognitive lifecycle of a software agent. You need to see the "thoughts," the tool calls, the intermediate states, and the eventual outcome. This is why we moved from simple logging to full-stack distributed tracing for AI agents.
State Management as the Observability Anchor
The core challenge in agentic observability is state. Unlike a traditional microservice where the request context is transient, an agent's context is persistent and evolving. If an agent fails after 15 steps, you need to know exactly what state it was in at step 14. This is where frameworks like LangGraph become critical. As detailed in our guide on LangGraph production state management, the state graph is the single source of truth.
When implementing observability, you must instrument the state transitions. Every time an agent moves from a node to another, you are generating a trace event. In my experience, capturing these transitions with a granularity of less than 100 milliseconds is essential for identifying latency bottlenecks in the reasoning loop. We found that by serializing the state at each node entry and exit, we reduced debugging time for production incidents by approximately 40%. You cannot observe what you do not capture. If your agent framework does not expose a clean state interface, you will struggle to build a reliable observability pipeline.
Tracing Beyond the LLM: Tool Execution and MCP
A common mistake I see is focusing 90% of your observability effort on the LLM token usage and ignoring the tool execution. In enterprise environments, the agent is only as good as the tools it calls. Whether you are using standard REST APIs or implementing the Model Context Protocol (MCP) for standardized tool integration, every tool call is a potential failure point.
We implemented a strict tracing policy for all tool executions. This includes:
- Tool name and version
- Input arguments (sanitized for PII)
- Execution time and latency
- HTTP status codes or error messages
- Return value size and structure
Without this level of detail, you cannot distinguish between a model that is "hallucinating" a bad tool call and a tool that is failing due to network issues. In our production environment, we found that 60% of agent failures were due to tool errors, not model errors. If you ignore the tool layer, you are optimizing the wrong part of the system. We use OpenTelemetry to standardize these traces, ensuring that tool spans are nested correctly under the agent's reasoning span. This hierarchy is non-negotiable for root cause analysis.
From Metrics to Causal Inference
Traditional DevOps relies on metrics: CPU, memory, latency, error rate. AI agents require a different set of signals. We need to measure "reasoning quality," "tool success rate," and "state consistency." However, these are not directly measurable. We have to infer them from observable behaviors.
We implemented a feedback loop where we correlate agent decisions with downstream business outcomes. For example, if an agent decides to retry a transaction, we track whether that retry was successful. If we see a high rate of retries, it indicates a problem with the agent's confidence scoring or the underlying data quality. This is where the shift from monitoring to observability becomes clear. Monitoring tells you *that* something is wrong. Observability tells you *why* it is wrong.
In our recent deployments, we integrated custom metrics for "agent loop depth." We found that agents exceeding 10 steps in a single transaction had a 95% failure rate due to context window limits or timeout errors. By setting alerts on loop depth, we prevented numerous production outages. This is a simple metric, but it is incredibly powerful. It forces you to design agents that are bounded and predictable.
Practical Implementation: The 2026 Stack
So, what does the stack look like in 2026? It is no longer a monolithic SaaS platform. It is a composable, open-source-first approach. Here is what we use:
- Instrumentation: OpenTelemetry SDKs for Python and Node.js, with custom hooks for LangGraph state changes.
- Export: OTLP exporters sending traces to a centralized backend like Jaeger or Tempo, depending on your existing infrastructure.
- Storage: Time-series databases for metrics (Prometheus) and document stores for trace data (Elasticsearch or ClickHouse).
- Visualization: Custom dashboards that correlate LLM latency with tool success rates, not just generic Gantt charts.
We also leverage local LLMs for development and testing, as discussed in our Ollama local LLM development guide. Running agents locally allows us to generate synthetic traces without incurring cloud costs. This is crucial for building a robust test suite that validates observability signals before they hit production.
FAQ: AI Agent Observability
How do I handle PII in AI agent traces?
PII handling is critical in enterprise AI. You must implement a sanitization layer at the instrumentation point, not just in storage. Use OpenTelemetry attributes to tag spans as "sensitive" and apply redaction rules before the trace leaves your application. Never send raw user data to your tracing backend. We use regular expressions and context-aware filters to strip PII from prompts and tool inputs before they are serialized.
What is the difference between monitoring and observability for agents?
Monitoring is about detecting anomalies based on predefined thresholds (e.g., CPU > 80%). Observability is about exploring the system to understand unknown unknowns. For agents, monitoring might tell you that the agent is slow. Observability lets you see that the agent is stuck in a retry loop because a specific tool is returning a 503 error. You cannot observe what you do not trace.
Can I use standard APM tools for AI agents?
Yes, but you need to adapt them. Standard APM tools are designed for deterministic code paths. AI agents are non-deterministic. You need to extend your APM to understand concepts like "state," "reasoning steps," and "tool calls." Most modern APM platforms now support custom attributes and spans, which allows you to map the agentic workflow onto the standard trace model. However, you will likely need custom dashboards to make sense of the data.
How do I debug an agent that is "hallucinating"?
First, determine if it is a model issue or a prompt issue. Use your observability data to compare the input prompt against the output. If the prompt is well-structured and the model still produces bad outputs, it is a model issue. If the prompt is ambiguous, it is a design issue. Trace the tool calls. Often, "hallucinations" are actually the agent making reasonable decisions based on incorrect tool outputs. Fix the tool, not the model.