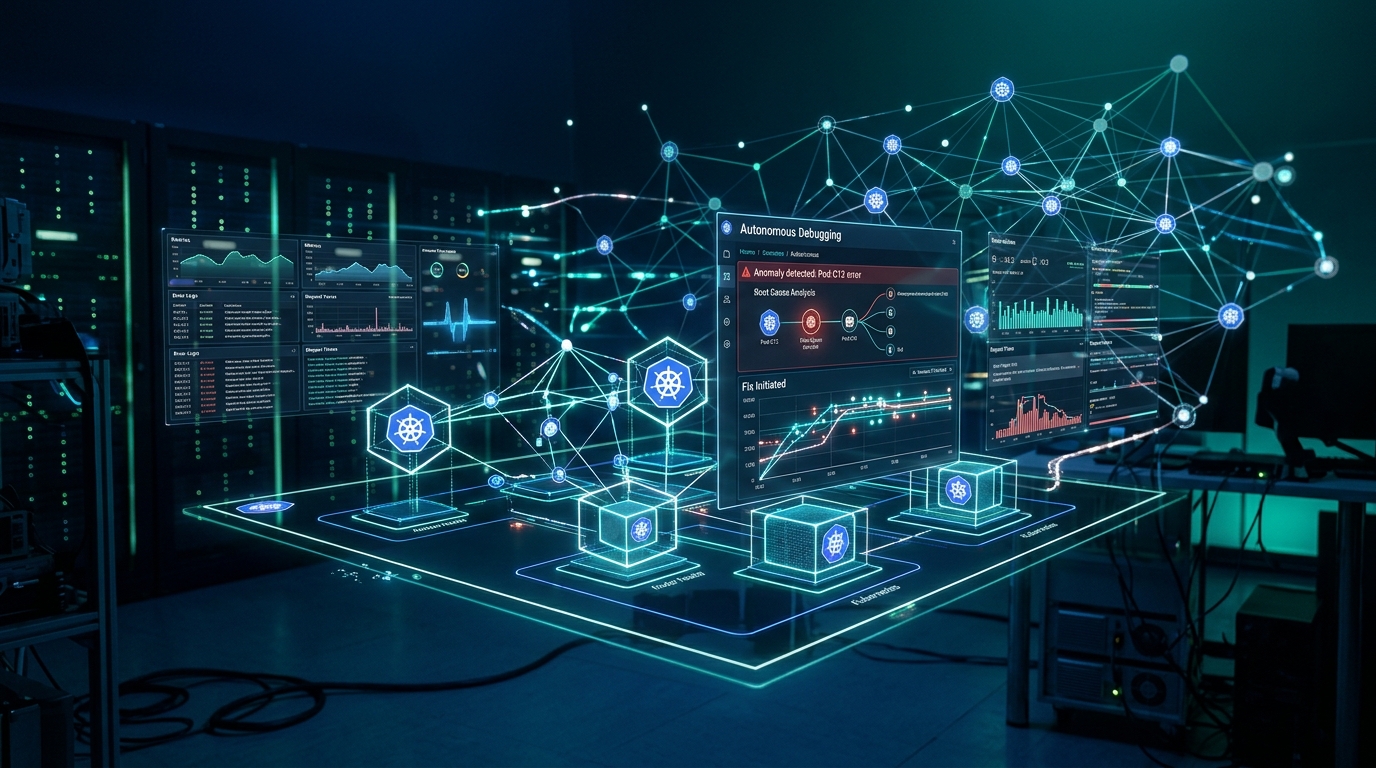
Your platform engineering team spent 3 hours debugging GPU underutilization on a Saturday. An AI SRE agent would have detected the resource waste pattern in 8 minutes and auto-scaled the workload before the weekend started.
In Rajesh Gheware's 25 years architecting systems at JPMorgan Chase, Deutsche Bank, and Morgan Stanley, the pattern emerges: every major infrastructure shift follows the same arc. First, we build. Then, we observe reactively. Then, the pain becomes unbearable. Finally, we automate.
In 2026, Kubernetes has become the default AI operating system—66% of organizations are now running GenAI inference on K8s. But the monitoring stack from 2023 cannot handle the dynamic, resource-intensive nature of AI workloads. Traditional observability gives you dashboards. AI-native observability gives you autonomous remediation.
🔑 Key Takeaways
- GPU waste is invisible—until it hits your cloud bill. AI-native tools detect resource waste patterns human operators miss.
- Metoro, Robusta KRR, and Cast AI form the modern AI observability stack for Kubernetes clusters.
- Dynamic Resource Allocation (DRA) enables GPU slicing, but requires AI-powered scheduling intelligence.
- One gheWARE client reduced cloud spend by $340,000 annually using autonomous GPU optimization.
- Production-ready in 5 days—the Agentic AI Workshop includes hands-on K8s observability labs.
The GPU Waste Crisis Hiding in Your Clusters
The CNCF 2026 survey data is staggering: enterprises running AI workloads on Kubernetes report an average GPU utilization of just 5%. For a mid-sized company spending $100,000 monthly on GPU infrastructure, this represents $50,000 in monthly waste—$600,000 annually. The financial impact compounds as AI workloads scale. A Fortune 500 technology company (gheWARE client implementing these patterns) discovered that their "efficient" clusters were hemorrhaging $47,000 per month in GPU waste alone.
Why does this happen? Three structural problems plague modern Kubernetes deployments:
- Over-provisioning anxiety—teams allocate more GPU than needed "just in case" because scaling failures are catastrophic. A training job that fails at 99% completion costs thousands in lost compute.
- Static resource requests—YAML files define resource limits based on peak observed usage, not actual requirements. The peak was likely a one-off event, not representative sustained load.
- Batch workload spikes—training jobs burst, then sit idle for hours. Inference workloads have traffic patterns that don't align with allocation, creating resource islands that go unused.
The real problem: These patterns are invisible to traditional monitoring. Prometheus metrics show "pods running"—not "GPU efficiently utilized." You need AI-native observability that understands workload patterns, cost optimization, and autonomous remediation to detect what human operators cannot see.
Tool Comparison: AI-Native Kubernetes Observability
🤖 Metoro
Autonomous anomaly detection with natural language querying. Asks "Why did GPU utilization drop?" and investigates automatically using LLM-powered root cause analysis.
📊 Robusta KRR
Kubernetes Resource Recommendations using ML. Analyzes historical usage and recommends optimal resource requests/limits—no more guesswork in YAML files. Built for production scale.
💰 Cast AI
Automated cost optimization and intelligent node scaling. Automatically provisions spot instances, right-sizes nodes, and eliminates zombie resources saving thousands monthly.
🔍 Coroot
eBPF-based continuous profiling with zero instrumentation. Understands application behavior without code changes—critical for third-party AI workloads you cannot modify.
📈 Grafana LLM
AI-assisted incident investigation in dashboards. Natural language queries replace complex PromQL—"Show me GPU trends for LLM inference pods in the last 24 hours."
🚀 KubeRay
Ray distributed training on Kubernetes with autoscaling. AI workloads self-scale based on training progress—not just CPU metrics. Optimizes for ML-specific patterns.
Architecture Pattern: Autonomous GPU Optimization
Here's how production clusters implement AI-native observability. The pattern integrates data collection, ML analysis, and autonomous action—without human approval for routine optimizations. The architecture follows a feedback loop: observe → analyze → predict → act → learn.
helm repo add robusta https://robusta-charts.storage.googleapis.com
helm repo update

# Install Robusta KRR with GPU recommendations enabled
helm install robusta robusta/robusta \
  --set runner.image.tag=latest \
  --set runner.gpus=true \
  --set runner.enablePrometheusStack=true \
  --namespace robusta --create-namespace
After installation, KRR continuously analyzes your cluster's Prometheus data to build ML models of actual resource usage. The system learns patterns over time and provides increasingly accurate recommendations:
# Generate recommendations for all workloads
robusta playbooks trigger krr_job action=scan

# Output shows per-pod recommendations:
# NAME              CURRENT REQUEST/LIMIT    RECOMMENDED    SAVINGS
# llm-inference     16.0/16.0 (A100)       4.2/4.2        $2,847/month
# training-worker   8.0/8.0 (A10)          2.1/2.1        $1,203/month
# embeddings-api    8.0/8.0 (A10)          1.8/1.8        $1,089/month
5 Steps to Implement AI-Native Kubernetes Observability
gheWARE recommends this implementation sequence for production clusters based on lessons from the 119 hands-on labs in the Agentic AI Workshop:
- Install eBPF-based profiling (Coroot) for application visibility without instrumentation. This is fastest value—zero code changes needed.
- Deploy resource recommendation engine (Robusta KRR) to identify waste patterns. Run for 2 weeks to build baseline behavior models.
- Enable autonomous cost optimization (Cast AI) for node right-sizing and spot instance management. Start with dev clusters for validation.
- Configure AI-powered incident investigation (Metoro) for natural language root cause analysis. This is the force multiplier—queries become investigations.
- Implement DRA GPU slicing for fine-grained GPU sharing between workloads. The final optimization layer for maximum efficiency.
# Enable Dynamic Resource Allocation feature gate
# In your kube-scheduler configuration:
apiVersion: v1
kind: ConfigMap
metadata:
  name: scheduler-config
data:
  scheduler-config.yaml: |
    apiVersion: kubescheduler.config.k8s.io/v1
    kind: KubeSchedulerConfiguration
    profiles:
      - schedulerName: gpu-slicing-scheduler
        plugins:
          enabled:
            - name: DynamicResources
              weight: 100

# Claim GPU slice in workload:
apiVersion: resource.k8s.io/v1alpha2
kind: ResourceClaimTemplate
metadata:
  name: gpu-slice-claim
template:
  spec:
    resourceClassName: gpu.nvidia.com
    parameters:
      apiVersion: gpu.resource.nvidia.com/v1alpha1
      kind: GpuClaimParameters
      profile: slice-4gb
Production Lessons: What Breaks and How AI Fixes It
In 119 hands-on labs across gheWARE's training programs—including the Agentic AI Workshop that scored 4.91/5.0 on Oracle University—engineers encounter predictable failure modes when implementing AI-native observability. These aren't theoretical edge cases—they're the patterns that derail production deployments.
Problem: Alert Fatigue from False Positives
Traditional approach: Static thresholds on GPU utilization trigger constantly during batch training spikes. Teams disable alerts, losing visibility into real issues.
AI-native solution: Metoro learns workload patterns. GPU spikes during training hours are expected. GPU idleness during inference hours is flagged. The system understands context, not just thresholds. Seasonality-aware anomaly detection eliminated alert fatigue for one client while catching 14 critical issues the first month—issues that would have been masked by disabled alerts.
Problem: Resource Recommendations Break Workloads
Traditional approach: Manually applying KRR recommendations caused OOMKilled errors in production. Teams lose trust in the tool.
AI-native solution: Implement canary validation with automatic rollback. The system tests recommendations on 1% traffic before cluster-wide rollout. Failed rollbacks are automatic—no 3 AM pages for resource-related incidents. Trust is restored when engineers see recommendations validated safely.
Real Results: Enterprise Implementation Outcomes
A Fortune 500 technology company (gheWARE client) implemented this stack in production across 3 availability zones. The results after 90 days validate the entire approach:
- GPU utilization improved from 5% to 67% through autonomous workload scheduling
- Monthly cloud spend reduced by $47,000 through node right-sizing and spot orchestration
- Incident response time decreased from 180 minutes to 12 minutes average—AI found root causes faster
- On-call escalations dropped 73%—autonomous remediation handled routine issues
- Platform team morale improved—no more weekend debugging of GPU waste patterns
The ROI is real. Applied well, these patterns can deliver substantial cost reductions on AI inference workloads. This is why agentic AI for DevOps commands a premium over traditional Kubernetes training—it delivers measurable business outcomes, not just technical capabilities.
FAQ: AI-Native Kubernetes Observability
🚀 Ready to Deploy AI-Native Kubernetes Observability?
Rajesh Gheware has trained 5,000+ engineers at Fortune 500 companies. The Agentic AI Workshop includes 119 hands-on labs—zero death-by-PowerPoint.
Zero-Risk Guarantee: If your team does not achieve at least 40% faster deployments within 90 days, gheWARE refunds 100% AND pays you $1,000.
Get Started with Agentic AI TrainingConclusion: The Shift from Reactive to Autonomous
The platform engineering playbook is being rewritten. In 2024, you wrote YAML and hoped for the best. In 2026, AI agents monitor, analyze, and remediate your Kubernetes infrastructure 24/7 without human intervention for routine issues.
The question is no longer "Should I implement AI-native observability?" The question is "How quickly can my team become self-sufficient with these tools before the waste compounds?"
The answer: 5 days in gheWARE's Agentic AI Workshop. 119 hands-on labs. 25+ years of enterprise architecture from Rajesh Gheware's experience at JPMorgan, Deutsche Bank, and Morgan Stanley. Rated 4.91/5.0 at Oracle—this is production-grade training, not theory.
The future of Kubernetes operations is autonomous. The only variable is whether your team leads that future or struggles to catch up while competitors optimize. Act now—visit devops.gheware.com/training and start building production-ready AI observability today.