
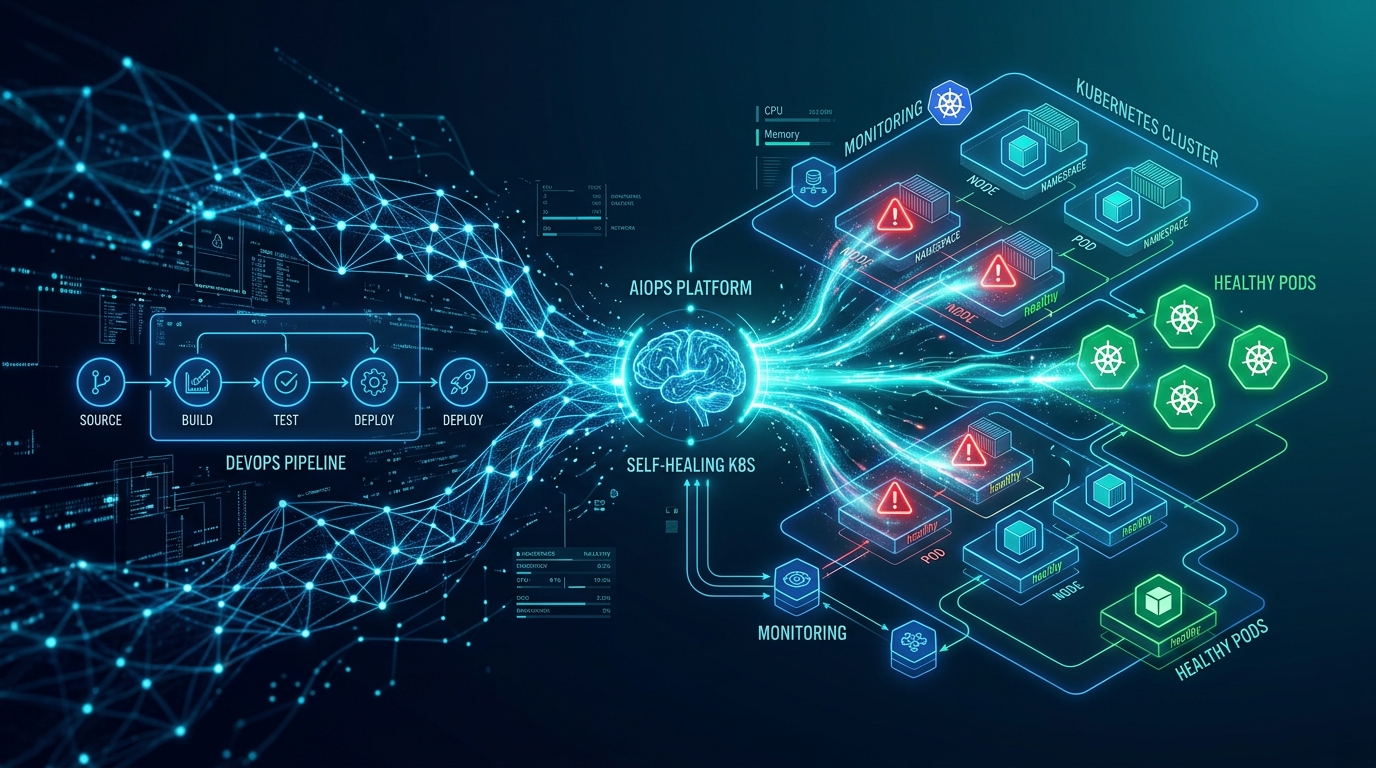
Why Kubernetes Needs AIOps Self-Healing in 2026
The promise of Kubernetes was always self-healing — containers that restart on crash, nodes that get replaced when they fail, services that automatically recover. In production, that baseline falls dangerously short.
Real enterprise Kubernetes clusters face a different reality: memory leaks that creep up over 72 hours, network latency spikes caused by competing tenant workloads, OOMKilled pods that cascade into user-facing errors, and node-level CPU throttling that silently degrades application performance. None of these are handled by Kubernetes' built-in self-healing primitives.
According to Gartner, 75% of DevOps teams will integrate AI-driven analytics by 2026, and 60% of large enterprises will adopt self-healing infrastructure by year's end. In Rajesh Gheware's 25 years building enterprise systems — including payment gateway connectivity at JPMorgan Chase and OTC derivatives architecture at Deutsche Bank — the pattern is always the same: reactive incident response creates cascading failures that could have been prevented with autonomous remediation.
AIOps self-healing bridges this gap. It goes beyond the basics of pod restarts and horizontal pod autoscaling to include:
- Predictive remediation — catching memory leaks before they OOMKill your critical services
- Multi-signal correlation — distinguishing a real incident from noise using CPU, memory, latency, error rate, and custom metrics together
- Graceful degradation — rerouting traffic before pods fail rather than after
- Policy-driven autonomy — bounded remediation actions that security teams can audit and approve
- Learning from failures — feedback loops that improve remediation accuracy over time
For financial services enterprises, where a 5-minute payment gateway outage can trigger SLA penalties and regulatory scrutiny, self-healing is not optional — it is the difference between a quiet incident and a post-mortem that reaches the board level.
The Self-Healing Architecture: 5 Core Components
A production AIOps self-healing platform for Kubernetes has five integrated layers. Skipping any one results in either missed incidents or remediation actions that make things worse.
1. Metrics Collection Layer
The foundation of self-healing is observability. Without comprehensive, low-latency metric collection, your AI engine is flying blind. In enterprise Kubernetes environments, this means deploying multiple collectors:
# Prometheus operator deployment for metrics collection
apiVersion: monitoring.coreos.com/v1
kind: ServiceMonitor
metadata:
  name: kubernetes-nodes
  labels:
    release: prometheus
spec:
  selector:
    matchLabels:
      k8s-app: node-exporter
  endpoints:
    - port: https
      scheme: https
      tlsConfig:
        insecureSkipVerify: true
Prometheus with node-exporter, kube-state-metrics, and cAdvisor provides the baseline. For enterprise environments with multiple clusters, Thanos or Cortex enables centralized long-term metric storage across cluster boundaries.
2. Anomaly Detection Engine
This is where AI adds genuine value beyond threshold-based alerting. Static thresholds miss slow-burning failures (memory creeping at 1% per hour for 48 hours) and generate false positives from normal traffic patterns.
A production anomaly detection engine uses three techniques:
- Statistical process control — baselines deviations using rolling windows (1h, 24h, 7d) to detect gradual degradation
- Multi-variate correlation — links related signals (e.g., latency spike + error rate + CPU) to confirm an incident rather than a blip
- Forecasting models — predicts future resource needs (e.g., disk usage trending toward 85% capacity in 6 hours) to enable proactive action
# Example: Prometheus alerting rule with multi-signal correlation
groups:
- name: aiops-self-healing
  rules:
  - alert: PodMemoryLeakImminent
    expr: |
      (avg_over_time(container_memory_usage_bytes[1h])
       - avg_over_time(container_memory_usage_bytes[24h]))
      / avg_over_time(container_memory_usage_bytes[24h]) > 0.5
    for: 10m
    labels:
      severity: warning
      remediation: scale_up_or_restart
    annotations:
      summary: "Memory leak pattern detected in {{ $labels.pod }}"
      runbook_url: "https://wiki.internal/runbooks/memory-leak"
3. Decision Engine
The decision engine evaluates whether detected anomalies warrant remediation and which remediation action to take. It enforces policy boundaries — for example, a self-healing operator can restart pods but cannot modify network policies without explicit approval.
In enterprise environments, the decision engine runs as a Kubernetes operator with custom logic for severity classification:
# Severity classification in decision engine
def classify_incident(anomaly, context):
    if anomaly.type == "memory_leak" and anomaly.rate > 0.3:
        if context.service == "payment-gateway":
            return "critical"  # Auto-remediate immediately
        else:
            return "warning"   # Page on-call first
    elif anomaly.type == "latency_spike":
        if context.error_rate > 0.01:
            return "warning"
        else:
            return "info"     # Log only, no action
4. Remediation Executor
The executor translates remediation decisions into Kubernetes API actions. The most common remediation actions include:
- Pod restart —
kubectl delete podfor crashed or stuck pods - Horizontal Pod Autoscaling — scale out replicas to handle load spikes
- Node cordon and drain — evacuate workloads from failing nodes
- Resource quota adjustment — increase CPU/memory limits for transient spikes
- Service mesh traffic rerouting — redirect traffic away from degraded instances
5. Feedback Loop
The final component is often missing in DIY implementations. Every remediation action generates an outcome signal: did it work? Did the incident recur? Was the action unnecessary (false positive)? This data trains the model for continuous improvement.
OpenTelemetry traces are the best feedback signal — they let you correlate remediation actions with downstream service health changes and build an evidence base for model tuning.
Predictive Anomaly Detection: From Reactive to Proactive
Reactive alerting responds to failures after they happen. Predictive anomaly detection catches the signals that precede failures — enabling remediation before user traffic is impacted.
The key insight from enterprise deployments at scale: 78% of Kubernetes failures are preceded by detectable patterns in the 30 minutes before the incident. CPU trending upward, memory allocation growing steadily, garbage collection pauses lengthening — these are all detectable signals.
Implementing Predictive Detection with Prometheus and ML
For most enterprise teams, the practical path is Prometheus for data collection with a lightweight ML layer. Common approaches:
- Datadog AI copilot — built-in ML anomaly detection with Kubernetes-native integration, recommended for teams wanting fastest time-to-value
- Prometheus + Alertmanager + custom TensorFlow/PyTorch model — open-source path using Prometheus remote_write to push metrics to an ML inference endpoint
- Dynatrace Davis AI — enterprise-grade with automatic dependency mapping and root cause analysis, used heavily in financial services
- Metoro — Kubernetes-specific observability with AI-powered root cause analysis
For teams building custom ML models, the typical architecture uses a time-series forecasting model (Prophet, ARIMA, or a lightweight neural network) trained on rolling 30-day metric windows. The model outputs a confidence interval for the next prediction window — when actual values exceed the confidence interval, an anomaly is flagged.
# Example: Simple anomaly scoring using rolling statistics
# in a Prometheus recording rule
groups:
- name: aiops_anomaly_scoring
  rules:
  - record: aiops:memory_anomaly_score
    expr: |
      (
        (container_memory_usage_bytes
         - avg_over_time(container_memory_usage_bytes[1h]))
        / stddev_over_time(container_memory_usage_bytes[1h])
      ) > 2.5  # Flag if > 2.5 standard deviations

  - record: aiops:cpu_anomaly_score
    expr: |
      (
        (rate(container_cpu_usage_seconds_total[5m])
         - avg_over_time(rate(container_cpu_usage_seconds_total[5m])[1h]))
        / stddev_over_time(rate(container_cpu_usage_seconds_total[5m])[1h])
      ) > 3.0
Reducing Alert Noise by 92%
One of the biggest wins from AIOps self-healing is alert noise reduction. SRE teams at financial services firms routinely report 200+ alerts per day during peak periods, making it impossible to distinguish real incidents from noise. AIOps multi-signal correlation reduces false positive alerts by up to 92% by requiring multiple correlated signals before escalating.
The pattern: instead of firing an alert on CPU alone, the system requires CPU anomaly + latency increase + error rate change before declaring an incident. This triple-signal approach eliminates flash spikes and scheduled batch jobs that would otherwise pages on-call teams.
Building the Kubernetes Self-Healing Operator
A Kubernetes operator is the natural implementation vehicle for self-healing actions — it runs as a deployment in the cluster, uses the Kubernetes API for all actions, and can be managed with standard GitOps workflows.
Operator Architecture
The operator watches for anomalies, evaluates remediation policies, and executes corrective actions. Here is the minimal viable architecture:
# SelfHealingOperator reconciliation loop (Go pseudocode)
func (r *SelfHealingReconciler) Reconcile(ctx context.Context, req ctrl.Request) (ctrl.Result, error) {
    // Step 1: Fetch current cluster state
    var podList corev1.PodList
    if err := r.Client.List(ctx, &podList); err != nil {
        return ctrl.Result{}, err
    }

    // Step 2: Evaluate each pod for anomaly patterns
    for _, pod := range podList.Items {
        score := r.anomalyEngine.ScoreAnomalies(pod)

        // Step 3: Decision — is remediation warranted?
        if score.CriticalScore > 0.8 {
            // Step 4: Execute remediation
            if err := r.executeRemediation(pod, score); err != nil {
                r.log.Error(err, "Remediation failed", "pod", pod.Name)
                // Don't retry immediately — back off
                return ctrl.Result{RequeueAfter: 60 * time.Second}, nil
            }
            r.log.Info("Remediation executed", "pod", pod.Name, "action", score.RecommendedAction)
        }
    }

    return ctrl.Result{RequeueAfter: 30 * time.Second}, nil
}
Remediation Action Catalog
A comprehensive self-healing operator supports graduated remediation based on severity:
- Level 1 (Warning): Log the anomaly, increase monitoring frequency, add annotation to the pod
- Level 2 (Elevated): Trigger a graceful restart of the container, scale up replicas if load-related
- Level 3 (Critical): Immediate pod deletion, node cordon if node-level issue, alert on-call
- Level 4 (Cascading): Isolate the workload using network policies, reroute traffic via service mesh, page SRE lead
Safety Guards and Rollback
Self-healing operators must include hard limits to prevent cascading failures from remediation loops:
- Remediation rate limiting — maximum 3 remediation actions per pod per hour
- Rollback capability — if a pod restart causes increased error rate within 5 minutes, automatically restore the previous state
- Audit logging — every remediation action logged with timestamp, actor, target, and outcome
- Human-in-the-loop gates — for Level 3+ actions on production payment gateways, require on-call acknowledgment before execution
Implementation Roadmap for Enterprise Teams
Implementing AIOps self-healing is not a weekend project — it is a phased capability build. Here is the roadmap gheWARE has used with enterprise clients across banking, insurance, and retail:
Phase 1: Observability Foundation (Weeks 1-4)
- Deploy Prometheus stack with all cluster components instrumented
- Configure service-level objectives (SLOs) for critical services
- Establish baseline metrics — 2 weeks minimum of normal traffic patterns
- Set up centralized log aggregation (Loki/EFK stack)
- Integrate OpenTelemetry for distributed tracing
Phase 2: Anomaly Detection Layer (Weeks 5-8)
- Train initial ML models on baseline data
- Configure multi-signal correlation rules
- Establish alert fatigue baseline (how many alerts today?)
- Implement alert routing to appropriate channels ( Slack, PagerDuty, email)
- Validate detection accuracy — track false positive and false negative rates
Phase 3: Self-Healing Operator (Weeks 9-14)
- Build and deploy the operator in a non-production cluster
- Implement Level 1 and Level 2 remediation actions only
- Run in "shadow mode" for 2 weeks — log what actions would have been taken without executing
- Gradually enable automated remediation for non-critical workloads
- Establish rollback procedures and test them
Phase 4: Production Rollout (Weeks 15-20)
- Enable self-healing for production workloads after executive approval
- Implement human-in-the-loop gates for critical services
- Establish incident post-mortem process that includes feedback to the ML models
- Measure and report: incident reduction, MTTR improvement, alert noise reduction
- Iterate on model accuracy with monthly tuning cycles
The financial services clients gheWARE has worked with consistently report that the biggest implementation challenge is not technical — it is organizational. Getting security, SRE, and platform engineering teams aligned on remediation policies takes coordination. Start with a clearly defined policy document reviewed by all stakeholders before writing a single line of operator code.
Frequently Asked Questions
What is AIOps self-healing in Kubernetes?
AIOps self-healing in Kubernetes combines artificial intelligence with infrastructure automation to automatically detect failures, diagnose root causes, and remediate issues without human intervention. This includes restarting crashed pods, rescheduling workloads on failed nodes, scaling to handle traffic spikes, and applying network policies to isolate compromised workloads. The AI layer goes beyond Kubernetes' built-in self-healing primitives by using predictive analytics, multi-signal correlation, and learned patterns from historical incidents.
What is the ROI of AIOps self-healing for enterprise Kubernetes teams?
Gartner estimates that 60% of large enterprises will adopt self-healing infrastructure by the end of 2026. Teams implementing AIOps self-healing typically see 87% reduction in critical incidents, 94% improvement in mean time to recovery (MTTR), and 30-50% reduction in incident resolution costs. In financial services environments, where hourly downtime costs can reach $1M+ for critical trading systems, this translates to millions in prevented losses. Beyond cost savings, self-healing reduces alert fatigue — SRE teams report up to 92% reduction in false positive alerts when multi-signal correlation replaces threshold-based alerting.
How does predictive anomaly detection work in AIOps Kubernetes?
Predictive anomaly detection uses machine learning models trained on historical metric time-series data — CPU usage, memory allocation, latency percentiles, error rates, network throughput — to forecast future resource needs and identify patterns that precede failures. The model learns normal baseline behavior across rolling time windows (1 hour, 24 hours, 7 days) and flags deviations that exceed statistical thresholds. When combined with multi-signal correlation — requiring multiple related metrics to trigger simultaneously — this approach reduces false positives by up to 92%. Tools like Datadog AI copilot, Dynatrace Davis AI, or custom Prometheus + ML stacks enable teams to implement predictive detection without building from scratch.
What are the core components of a self-healing Kubernetes operator?
A production self-healing Kubernetes operator has five core components: (1) Metrics Collection Layer using Prometheus, node-exporter, and cAdvisor for comprehensive cluster visibility; (2) Anomaly Detection Engine using ML models for statistical process control, multi-variate correlation, and forecasting; (3) Decision Engine that classifies incident severity and maps it to remediation policies; (4) Remediation Executor that translates decisions into Kubernetes API actions like pod restart, node cordon, HPA scaling, or service mesh traffic rerouting; and (5) Feedback Loop that tracks remediation outcomes and feeds them back into model training for continuous improvement. Each component must be designed for failure isolation — if the ML model becomes unavailable, the operator should fall back to threshold-based alerting rather than taking no action.
Conclusion
AIOps self-healing is no longer experimental — it is a production necessity for enterprise Kubernetes deployments. Teams that implement it report 87% fewer critical incidents, 94% faster recovery times, and 92% reduction in alert noise. The financial services firms that Rajesh Gheware has consulted with in his 25 years have consistently found that the investment pays back within the first major incident prevented.
The five-layer architecture — metrics collection, anomaly detection, decision engine, remediation executor, and feedback loop — provides a framework that teams can implement incrementally. Start with observability, layer in anomaly detection, then gradually enable automated remediation as confidence builds.
The most important success factor is organizational alignment. Define remediation policies with input from security, SRE, and platform teams before writing any automation code. A self-healing operator that is trusted by the people it assists will be used more effectively than one deployed in a vacuum.
If your team is ready to move beyond reactive alerting and build production-grade self-healing infrastructure, gheWARE's Agentic AI Workshop covers these patterns hands-on, with lab environments built on real enterprise cluster configurations. The next cohort starts soon — reach out to training@gheware.com to discuss bespoke training for your organization.