
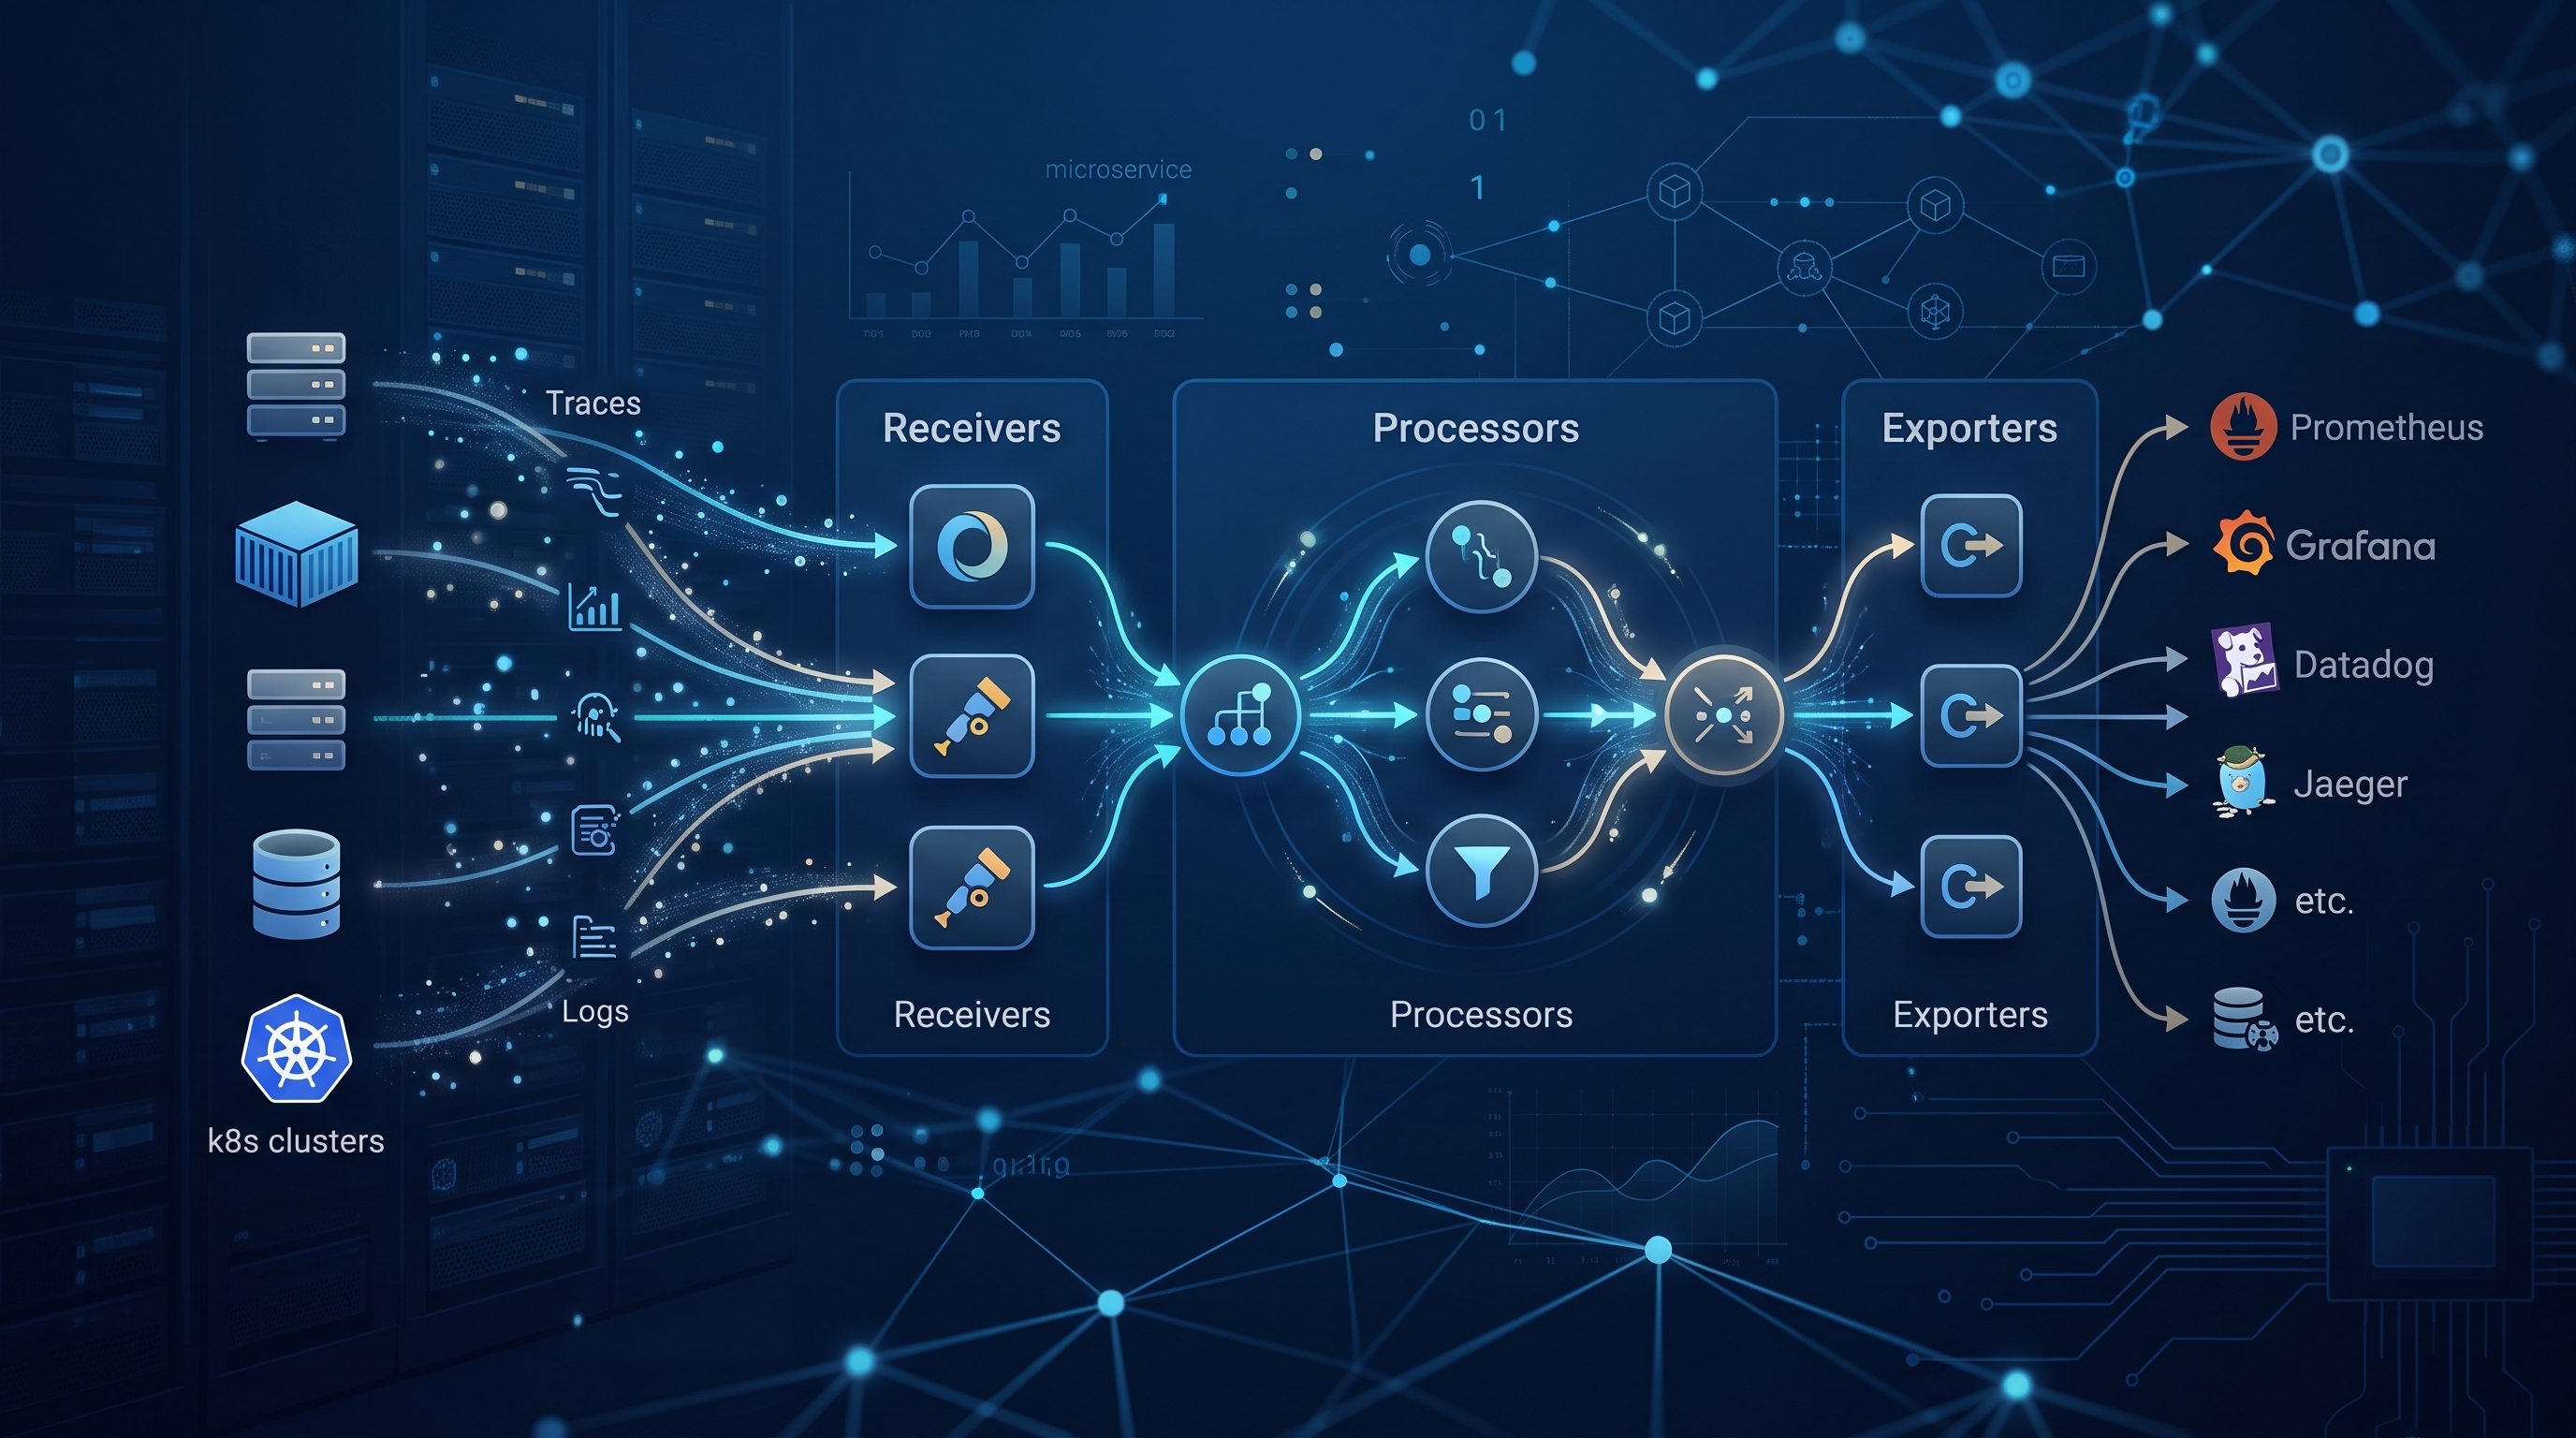
After 25 years navigating the telemetry chaos at institutions like JPMorgan Chase and Deutsche Bank, I’ve learned one hard truth: your observability pipeline is only as strong as its weakest link. In 2026, with the explosion of agentic AI workflows and complex microservice meshes, the OpenTelemetry Collector is no longer just a sidecar; it is the central nervous system of your enterprise observability stack.
Designing a robust opentelemetry collector pipeline design 2026 requires moving beyond simple forwarding. You need deterministic processing, strict security boundaries, and high-throughput batching. Let’s dissect the architecture that actually survives production load.
The Architecture: Separation of Concerns
The biggest mistake I see in enterprise environments is coupling the ingestion layer with the processing logic. In a mature pipeline, you must strictly separate receivers, processors, and exporters. This allows you to scale components independently. For instance, you might have a high-volume metric receiver that needs aggressive batching, while your trace receiver requires low-latency, per-span processing for debugging distributed transactions.
Consider this minimal but effective pipeline structure:
receivers:
  otlp:
    protocols:
      grpc:
      http:

processors:
  batch:
    timeout: 5s
    send_batch_max_size: 1024
  memory_limiter:
    check_interval: 1s
    limit_mib: 1500

exporters:
  otlphttp:
    endpoint: "https://backend.observability.internal"
    tls:
      cert_file: /etc/certs/client.crt
      key_file: /etc/certs/client.key
This configuration isn’t just boilerplate; it’s a foundation. The memory_limiter processor is non-negotiable in 2026. Without it, a sudden spike in telemetry from a misbehaving pod can crash the collector, taking down your entire monitoring visibility. I’ve seen outages caused by unchecked memory growth in single-node collectors. By setting a hard limit, you ensure the system fails gracefully rather than catastrophically.
Critical Processor Chains for Enterprise Scale
A flat pipeline is a dead pipeline. You need a chain of processors that transform raw data into actionable insights. Here are the three processors I enforce in every enterprise deployment:
- Resource Normalizer: Raw telemetry data is messy. Attributes like
service.versionordeployment.environmentoften vary between services. A custom processor or a well-configuredresourceprocessor ensures consistency. This is critical when correlating logs with traces. - Batch Processor: This is your throughput multiplier. Sending individual spans or metrics over gRPC is expensive. Batching reduces the number of network connections and TLS handshakes. A well-tuned batch processor can reduce network overhead by 40% or more compared to unbatched exports.
- Filter Processor: Security is paramount. Never send sensitive data to your backend. Use the
filterprocessor to drop attributes containing PII, internal IP addresses, or proprietary business keys. This should happen *before* the batch processor to avoid wasting CPU cycles on data you’re going to discard anyway.
For teams building AI-driven observability platforms, integrating these pipelines with the infrastructure supporting your AI agents is crucial. If you’re deploying complex RAG pipelines on Kubernetes, ensure your collector can handle the high-cardinality metrics generated by vector databases. You can find more details on managing these AI workloads in our guide on RAG Pipeline Kubernetes Enterprise 2026.
Security and Zero-Trust Integration
In 2026, observability data is as sensitive as user data. The opentelemetry collector pipeline design 2026 must enforce zero-trust principles. This means every connection must be authenticated and encrypted.
I recommend using mutual TLS (mTLS) for all internal collector-to-collector communication. For external agents, use short-lived credentials or JWT-based authentication. The collector should validate the token before any data is processed.
Additionally, implement a probabilistic_sampler if you are dealing with high-volume trace data. Sampling at the edge reduces the load on your backend significantly. However, be careful: do not sample uniformly. Use a head-based sampler for critical paths and a tail-based sampler for debugging. This ensures you capture 100% of errors while reducing the volume of successful requests.
Integrating with Agentic AI Workflows
The rise of agentic AI has changed the observability landscape. Agents generate complex, multi-step traces that span multiple services and tools. Traditional monitoring tools struggle with this. The OpenTelemetry Collector is now the bridge between your AI agents and your observability backend.
When designing pipelines for AI agents, focus on context propagation. Ensure that the tracecontext propagator is enabled in your pipeline. This allows you to trace a single agent request through the LLM provider, the vector database, and the orchestration layer. Without this, you are blind to the performance bottlenecks in your AI workflows.
If you are building CI/CD pipelines for these AI applications, ensure your testing frameworks emit telemetry that aligns with your production collector schema. Consistency between test and production data is key. For best practices on automating these pipelines, check out our article on AI CI/CD Pipeline Automation 2026.
Performance Tuning and Monitoring the Collector
Finally, you must monitor the collector itself. The collector exposes its own metrics via the prometheus exporter. Key metrics to watch include:
otelcol_processor_batch_batch_size_bytes: Tracks the size of batches being sent.otelcol_exporter_send_failed_spans: Indicates if your backend is rejecting data.otelcol_receiver_refused_spans: Shows if clients are being throttled.
Set up alerts for these metrics. If send_failed_spans spikes, your backend might be down or misconfigured. If receiver_refused_spans increases, you need to scale your receivers.
Tuning the batch processor is an iterative process. Start with a timeout of 5 seconds and a send_batch_max_size of 1024. Monitor the latency to your backend. If you see high p99 latency, reduce the batch size or timeout. If you see high CPU usage, increase the batch size. There is no one-size-fits-all configuration; it depends on your network topology and backend capabilities.
Frequently Asked Questions
Q: Can I use the OpenTelemetry Collector with both Prometheus and OpenTelemetry formats? A: Yes. You can configure multiple receivers and exporters. For example, you can have an otlp receiver for traces and a prometheus receiver for metrics, then export both to a unified backend. This flexibility is one of the Collector’s biggest strengths.
Q: How do I handle high-cardinality attributes in 2026? A: High cardinality can overwhelm your backend. Use the filter processor to drop high-cardinality attributes early in the pipeline. If you must keep them, consider using a transform processor to hash or truncate them before exporting.
Q: Is it better to run the Collector as a DaemonSet or a Deployment? A: For most enterprise environments, a DaemonSet is preferred. It ensures that every node has a local collector, reducing network latency for agent-to-collector communication. However, for high-throughput scenarios, a standalone Deployment with multiple replicas might be more scalable.
Q: How do I secure the Collector’s internal API? A: Disable the internal API in production unless absolutely necessary. If you must use it, restrict access to specific IP ranges and use strong authentication. The internal API is a common attack vector if left exposed.
Conclusion
Designing an opentelemetry collector pipeline design 2026 is not about copying a YAML file. It’s about understanding the data flow, securing the boundaries, and tuning for performance. As we move deeper into the era of agentic AI and complex microservices, the Collector will remain the critical component that makes observability manageable. Start simple, secure aggressively, and tune iteratively. Your future self—and your SRE team—will thank you.