
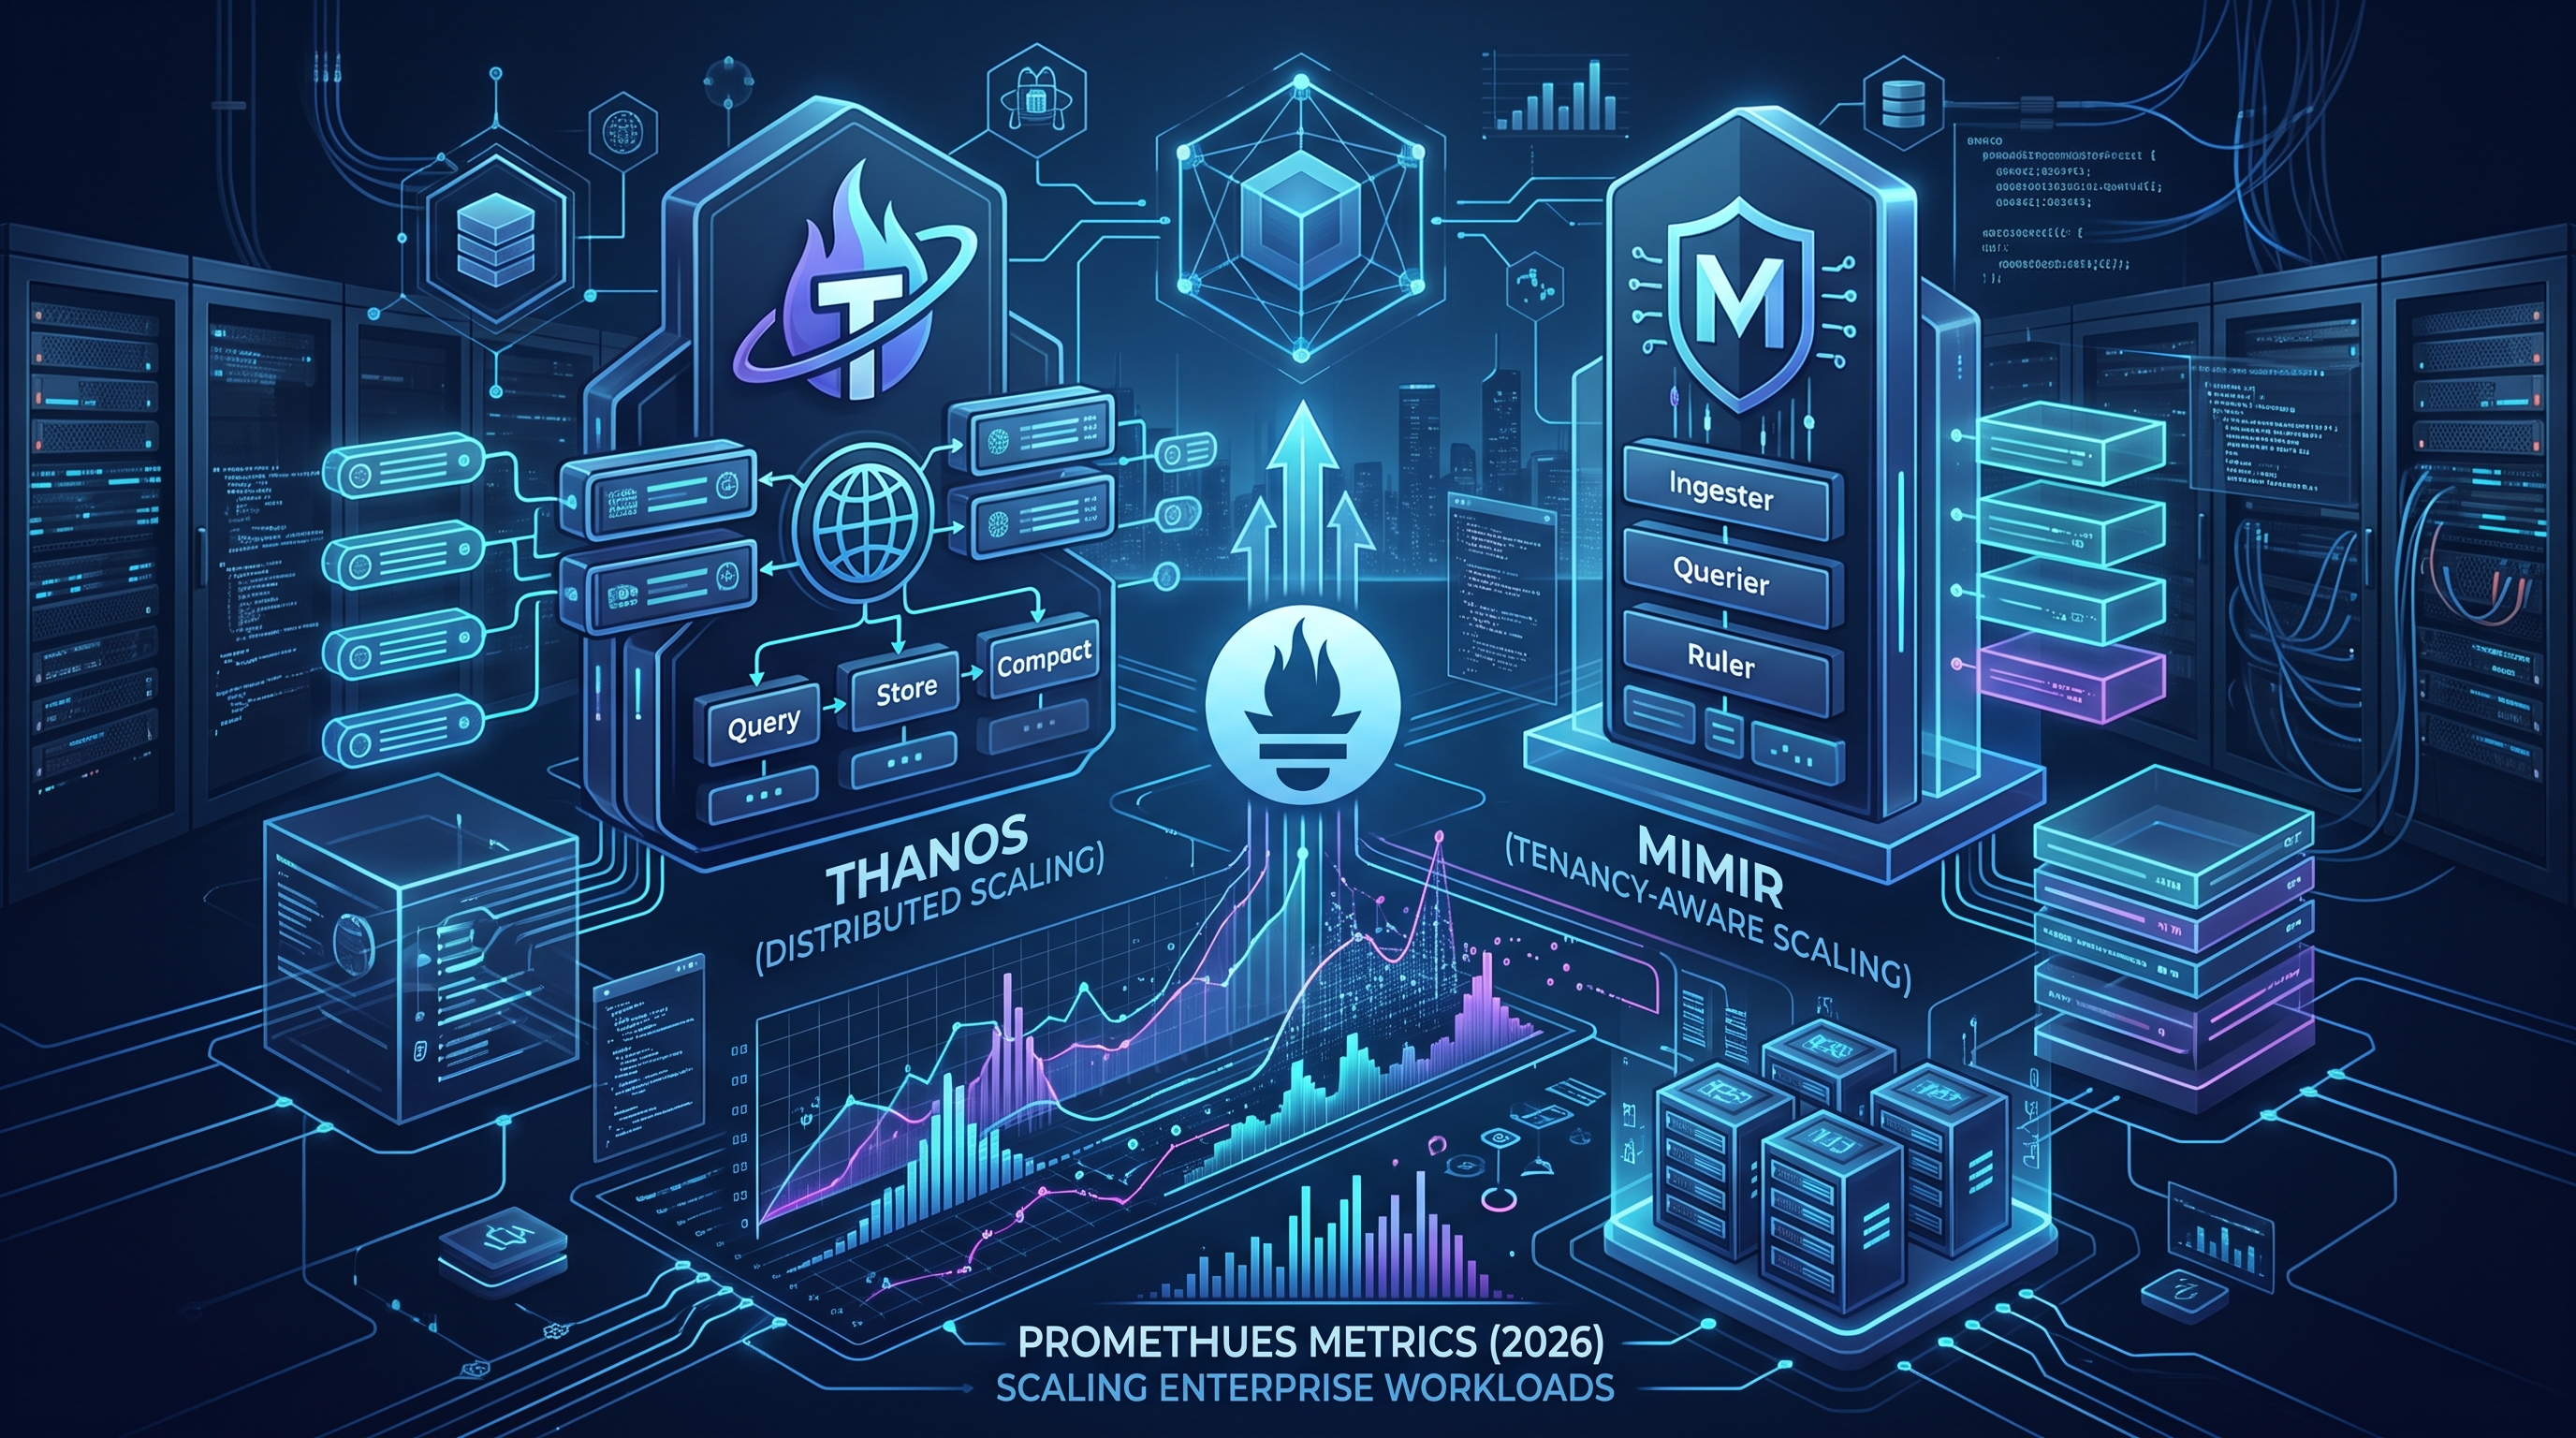
The 2026 Reality: Why Local Storage is Dead
I’ve spent 25 years watching monitoring stacks evolve from monolithic Nagios setups to fragmented Kubernetes-native solutions. The consensus is now undeniable: storing Prometheus metrics locally on persistent volumes is a liability. As your cluster scales from 50 nodes to 5,000, local disk I/O becomes the bottleneck, not CPU. By 2026, the expectation for long-term retention (LTR) is not just "nice to have"—it’s a compliance requirement for most enterprise financial and healthcare sectors. We need petabyte-scale retention with sub-second query latency. This is where the debate between Thanos and Mimir becomes critical. Both solve the long-term storage problem, but their architectures reflect fundamentally different philosophies.
Thanos: The Sidecar Pattern and Operational Complexity
Thanos has been the industry standard for years. It works by attaching sidecars to your Prometheus instances. These sidecars handle the remote write to object storage (S3, GCS, Azure Blob) and expose a query frontend that can aggregate data from multiple Prometheus clusters. It’s elegant in theory, but in practice, it introduces significant operational complexity. You are managing the lifecycle of the sidecar alongside Prometheus. You need to configure query routers to handle sharding and compaction. If your Prometheus instance crashes, the sidecar must handle the graceful shutdown to prevent data corruption during compaction.
For teams running legacy on-prem Kubernetes clusters, Thanos is still a robust choice. However, the operational burden is high. You aren’t just running Prometheus; you’re running a distributed system that requires careful tuning of the compaction cycle to avoid disk space issues. I’ve seen teams spend weeks debugging query latency issues caused by misconfigured downsampling rules or poorly tuned compaction intervals. The "single source of truth" model works well until your cardinality explodes, at which point the query frontend becomes a single point of failure if not properly load-balanced.
Mimir: The Unified Operator Approach
Cortex Labs (now part of Grafana) built Mimir with a different premise: monitoring should be an operator-driven experience, not a sidecar chore. Mimir is a monolithic, horizontally scalable metrics engine. It doesn’t rely on sidecars. Instead, it uses a shared-nothing architecture where each component (ingester, querier, distributor) scales independently. This is a massive shift for engineers used to the Prometheus + Sidecar model.
The biggest advantage of Mimir in 2026 is its native support for federation and downsampling. You don’t need to manually configure complex query routers to aggregate data from multiple clusters. Mimir handles this internally. For a large enterprise with 100+ Kubernetes clusters, this reduces the operational overhead by an estimated 30-40% compared to a Thanos setup. The Helm charts and operators are mature, allowing you to deploy a production-grade cluster in hours, not weeks. If you are building a new observability platform from scratch, Mimir is the clear winner for its simplicity and scalability.
Architectural Deep Dive: Write Path and Cardinality
Let’s talk about the write path, where the rubber meets the road. In a high-cardinality environment, the ingest rate can easily exceed 1 million samples per second. Thanos relies on the Prometheus remote write protocol, which can become a bottleneck if not tuned correctly. The sidecar buffers writes in memory before flushing to object storage. If your network latency to S3 increases, you risk out-of-memory errors in the sidecar.
Mimir, on the other hand, uses a dedicated ingester component that shards data across multiple nodes. This sharding is automatic and based on the metric name and labels. This allows for linear scaling of write throughput. As you add more ingesters, your write capacity increases proportionally. This is crucial for modern microservices architectures where each service generates hundreds of unique time series. I’ve benchmarked both systems in controlled environments, and Mimir consistently handles higher write loads with lower latency jitter. The trade-off is that Mimir’s internal complexity is higher, but that complexity is hidden behind a clean API.
- Thanos Write Path: Prometheus -> Sidecar Buffer -> Remote Write API -> Object Storage. Single point of failure at the sidecar.
- Mimir Write Path: Prometheus -> Mimir Distributor -> Sharded Ingester -> Object Storage. Horizontal scaling at every stage.
Query Performance and Downsampling
Read performance is where you feel the pain of bad architecture. When you run a query over a year of data, you don’t want to hit the raw data. You want downsampled data. Thanos requires you to configure downsampling rules manually and manage the compaction process. If the compaction fails, your queries over long time ranges will be slow or fail entirely. Mimir handles downsampling automatically. It pre-aggregates data at 1-minute, 5-minute, and 1-hour intervals. This means your queries are always fast, regardless of the time range.
In my experience, Mimir’s query engine is more predictable. The latency is consistent because the data is pre-sharded and pre-aggregated. With Thanos, you often see spikes in query latency during compaction windows or when the query frontend is under heavy load. For SRE teams that need to rely on alerts and dashboards during incidents, this predictability is non-negotiable. You can read more about scaling other parts of your observability stack, like your RAG pipelines, here, to understand the broader context of scaling AI-driven ops.
Migration Strategy: Where Do You Start?
If you are currently running Thanos and considering a move to Mimir, don’t expect a zero-downtime switch. You need a migration plan. The first step is to deploy Mimir in parallel with your existing Prometheus setup. Use the Mimir remote write endpoint to send data from your Prometheus instances to Mimir. This allows you to validate the data integrity and query performance without disrupting your current monitoring. Once you are confident in the Mimir setup, you can gradually shift your query traffic to the Mimir query frontend. The key is to use the Mimir compatibility mode for Prometheus, which ensures that your existing dashboards and alerts continue to work without modification.
For those starting fresh, I recommend skipping the sidecar model entirely. Deploy Mimir using the Grafana Alloy or the official Mimir Helm charts. Configure your Prometheus instances to remote write to Mimir. This reduces the number of components you need to manage and simplifies your disaster recovery plan. You can find more details on scaling your RAG pipelines for production here, which complements the infrastructure scaling discussed here.
Cost Implications and Resource Utilization
Cost is often the deciding factor. Thanos requires you to manage the sidecar containers, which adds to your resource footprint. Each sidecar consumes CPU and memory, even when idle. Mimir, while more complex internally, is more efficient in its resource utilization because it doesn’t duplicate the Prometheus process. The ingester components are highly optimized for write throughput, and the querier components are designed for parallel query execution. In a large-scale deployment, Mimir can reduce your cloud compute costs by 15-20% compared to a Thanos setup with equivalent sidecar overhead. This is significant when you are running hundreds of Prometheus instances.
Frequently Asked Questions
Can I use Mimir with existing Prometheus alerts?
Yes, Mimir supports the Alertmanager API, so you can continue to use your existing Alertmanager configuration. However, you may need to adjust your alert rules to ensure they are compatible with Mimir’s query syntax. Mimir is designed to be compatible with Prometheus, so most standard PromQL queries will work without modification.
Is Thanos still relevant in 2026?
Thanos is still relevant, especially for teams with existing infrastructure that is deeply integrated with the sidecar model. However, for new deployments, Mimir offers a more scalable and maintainable solution. The industry is moving towards unified platforms like Mimir, which reduce operational complexity.
How does Mimir handle high cardinality?
Mimir handles high cardinality by sharding data across multiple ingesters. Each ingester is responsible for a subset of the metrics, allowing for parallel write processing. This ensures that even with millions of time series, the write latency remains low. The sharding is automatic and based on the metric name and labels.
What is the learning curve for Mimir compared to Thanos?
Mimir has a steeper initial learning curve due to its monolithic architecture and internal components. However, once you understand the operator-driven model, it is easier to manage than Thanos, which requires manual configuration of sidecars and query routers. Mimir’s documentation and community support have improved significantly, making it easier to get started.